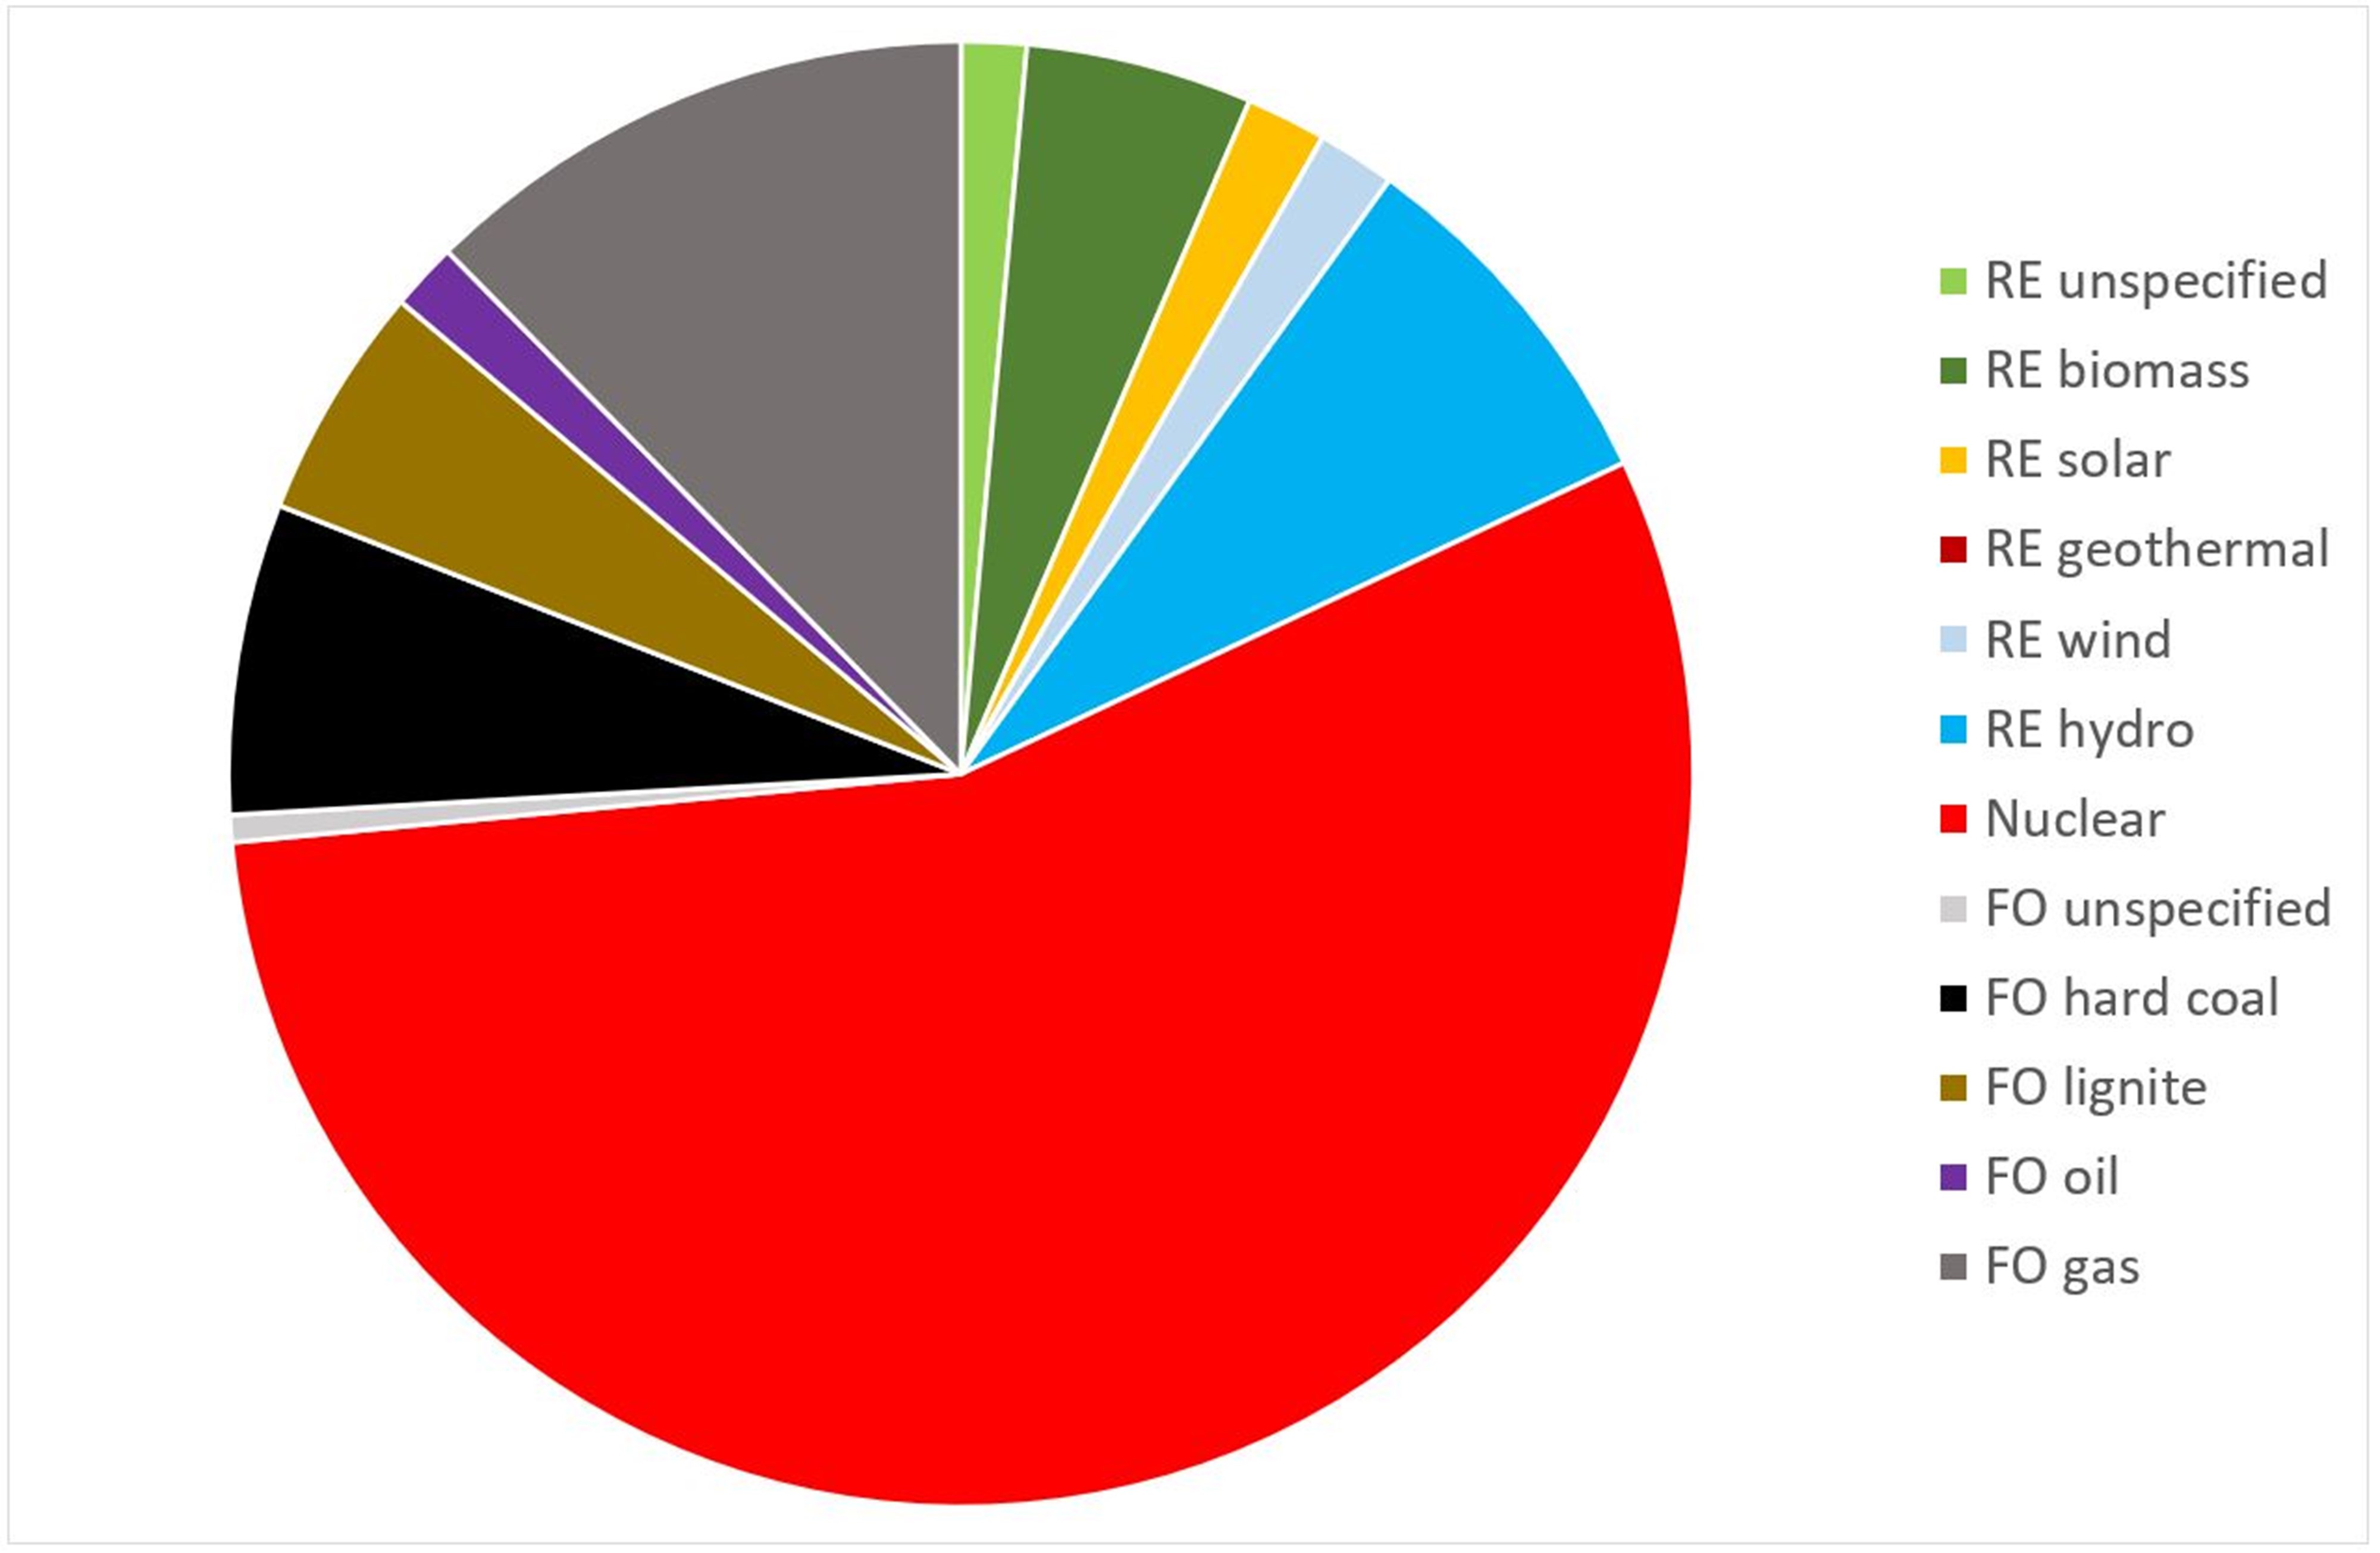
The national energy mix below is the final result for the year 2019 from data available up to 31st May 2020.
| Residual Mix | 2019 |
| RE Total | 18,02 % |
| RE unspecified | 1,44 % |
| RE biomass | 5,01 % |
| RE solar | 1,78 % |
| RE geothermal | 0,00 % |
| RE wind | 1,72 % |
| RE hydro | 8,07 % |
| Nuclear | 55,49 % |
| FO Total | 26,50 % |
| FO unspecified | 0,60 % |
| FO hard coal | 6,86 % |
| FO lignite | 5,18 % |
| FO oil | 1,49 % |
| FO gas | 12,36 % |

| Supplier Mix | 2019 |
| Volume (TWh) | 27,52 |
| RE unspecified | 1,36 % |
| RE biomass | 6,65 % |
| RE solar | 1,69 % |
| RE geothermal | 0,00 % |
| RE wind | 4,36 % |
| RE hydro | 8,70 % |
| Nuclear | 52,28 % |
| FO unspecified | 0,56 % |
| FO hard coal | 6,47 % |
| FO lignite | 4,88 % |
| FO oil | 1,40 % |
| FO gas | 11,65 % |
| Production Mix | 2019 |
| Volume (TWh) | 26,82 |
| RE unspecified | 1,70 % |
| RE biomass | 5,96 % |
| RE solar | 2,19 % |
| RE geothermal | 0,00 % |
| RE wind | 0,02 % |
| RE hydro | 16,02 % |
| Nuclear | 53,81 % |
| FO unspecified | 0,00 % |
| FO hard coal | 3,11 % |
| FO lignite | 5,29 % |
| FO oil | 1,48 % |
| FO gas | 10,30 % |

The energy mix also includes data on harmful substances (CO2 and radioactive waste),
that arise in the production of electricity from the energy mix.
| 2019 | Residual Mix | Supplier Mix | Production Mix |
| CO2 (gCO2/kWh) | 198,59 | 187,10 | 151,10 |
| Radioactive waste (mg/kWh) | 1,90 | 1,79 | 1,88 |